Introduction
This article focuses on the graphical user interface of TIBCO Statistica software called Workspace.
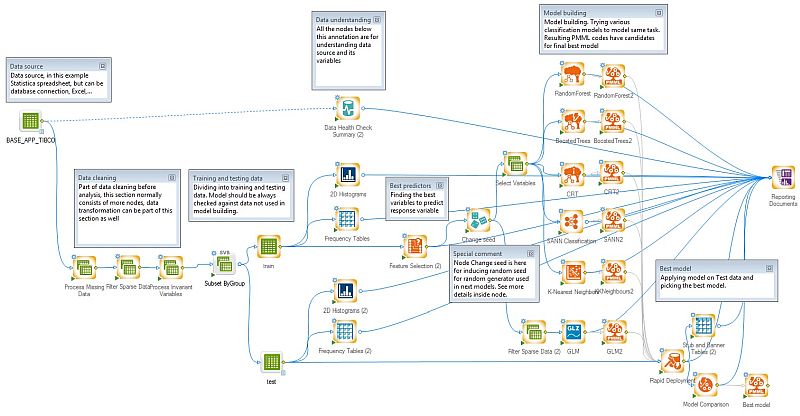
The Workspace environment is, in its default setting, a white canvas onto which you can drag individual nodes and logically connect them to one another. Each node represents one functionality of the software. By inserting a node and connecting it, you create an analytical process. In the workspace you can load, edit and merge data, prepare data for analysis, apply statistical methods, extract information from data, build predictive models and save results.
Advantages
A node-based user interface (without scripting).
- Visualization – visualization of the entire data analysis workflow from data input to the final result. Easier to understand for multiple users compared to scripting.
- Repeatability – the Workspace can be run repeatedly on updated data or new data sets (so-called datasets).
- Reproducibility – the steps of the entire project are set up and can be examined in terms of exactly what was done to obtain the final results; extensive documentation is also available.
- Flexibility – in the Workspace, the same analysis options/functionalities are available that you are used to from the classic interactive menu.
- Customizability – custom user nodes can be created in the Workspace and shared with other colleagues
Basic information
- The Workspace is the main object that contains the definition of the analysis.
- Files with saved Workspaces have the extension sdm.
- By default, a saved Workspace is a file of steps with complete settings without final outputs.
- By default, the results of the analysis are saved into a workbook node (Workbook) named Reporting Documents.
- The Workspace is one of the most important objects that can be stored in the Enterprise meta-repository. There it can be versioned, scheduled to run, have attributes set for user rights, etc. To save to the Enterprise meta-repository, use the Deploy button or, analogously, the menu option: Enterprise/Deploy to Enterprise/Workspace.
Nodes
Nodes are flexible and easy to use together within a single Workspace project. Nodes can be accessed from the Node Browser and from the menu and its individual tabs. When the Workspace is active, orange highlighting shows the available tabs with Workspace nodes.

The group of available nodes is governed by the configuration selected from the drop-down menu in the upper right corner of the workspace:

Basic information and node options:
- Each node represents one functional element of the software.
- A node or a group of nodes can be copied (Ctrl+C) and pasted (Ctrl+V) from one Workspace to another.
- Nodes can be deleted (Del key).
- Nodes can be moved using the arrow keys on the keyboard or by dragging.
- Nodes can be renamed.
Node properties
We have two types of nodes available: scripted and "new" nodes, which are fully compatible with the functions of the interactive user interface (the original interactive menu/ribbon).
"New nodes"
Most functions have a "new" form. Below you can see that the menu of these nodes has the same options as the functionalities in the interactive user interface (running functions separately, not in the Workspace). The advantage is that a user who is used to working with the interactive menu can very comfortably manage to start working in the Workspace environment. An example of the Descriptive Statistics function is below (the interactive dialog in the figure on the left, the node in the figure on the right).
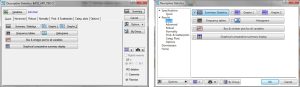
The selection of variables and all settings are done in the node itself.
Icons
A node icon has a pictogram and a color of this pictogram (colors: green for data operations, blue for statistical analyses, orange for modeling, dark blue for graphs, red for export functions and purple for Reporting Documents.
- Orange background – means that the node has not been run or a change in the node's settings has occurred. To execute such a node, all preceding nodes must be run.
- White background – the node has been run without error.
- Red color – an error occurred when running the node. Clicking the triangle-with-exclamation-mark icon displays the error message.

- Top left corner (gear wheel) – a left mouse click displays the dialog with the node's settings.
- Bottom left corner (green arrow) – runs this node and all preceding unexecuted nodes in the same branch.
- Top right corner (documents) – instead of the results of this node, opens the Reporting Documents workbook (Reporting Documents).
- Bottom right corner (sheet) – this is a downstream document; this table can be used as an input table in subsequent nodes.
- In the middle of the right edge of the icon (yellow diamond) – an arrow starts here; pressing the left mouse button and dragging to another node creates a connection between the nodes.
Special tabs in nodes
Each "new" node has two special tabs:
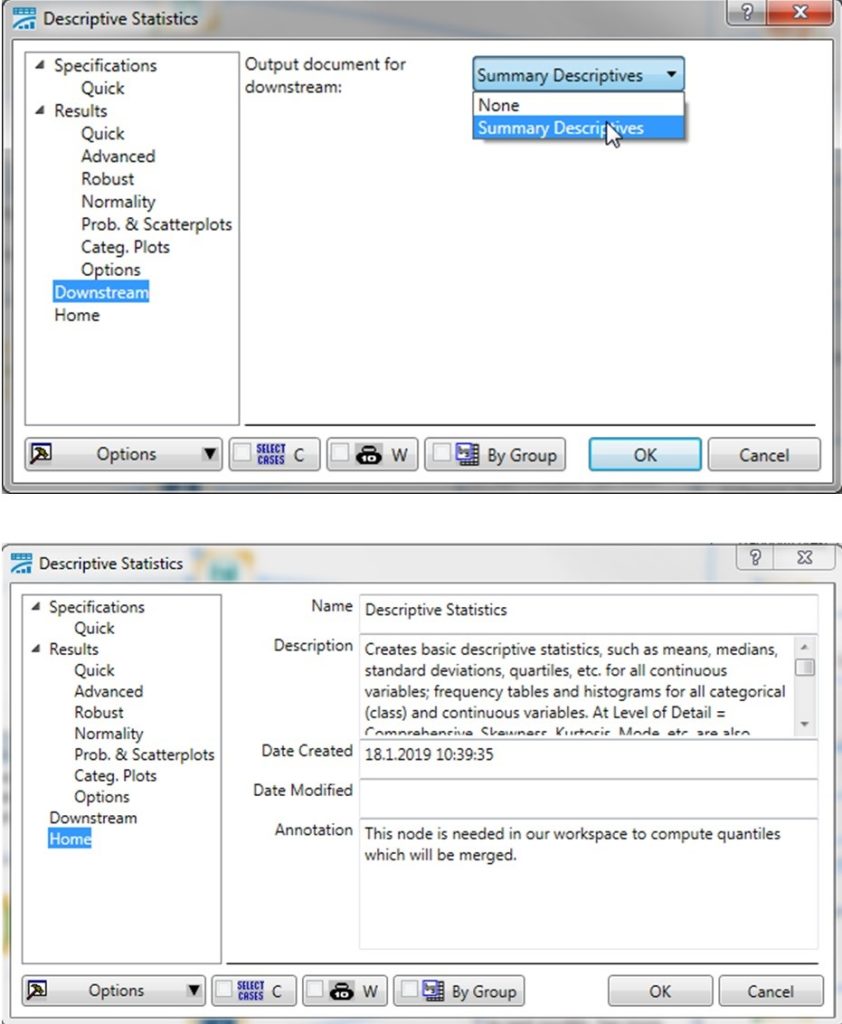
The Downstream tab, where the user can define one resulting table that will be available for further analyses (that is, which file appears in the bottom right corner of the node).
On the Home tab, the Description section contains the default description of the node's function. It also contains the dates when the node was created, or the date of change, which inform the user about when a given node was created or changed. The Annotation section is for including a custom description that can be useful for a better understanding of the workflow.
SVB nodes
The second set of nodes is called legacy or SVB nodes. You can recognize them by the letters SVB at the top of the node. If you change the Node Browser to Legacy Procedures, you will have only SVB nodes on your tabs.

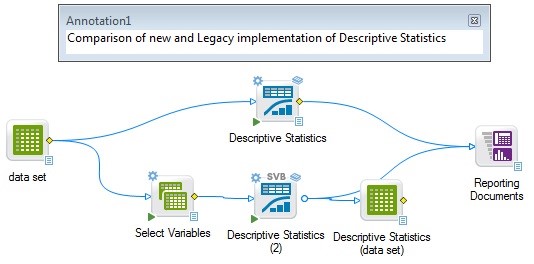
These nodes are constructed so that they have predefined outputs and predefined parameters displayed to the user. The user does not need to select each option as is possible in the "new" type of nodes. The fundamental difference lies in the fact that an SVB node usually does not have various selection options. Variables must be selected in advance in a preceding node. For this purpose the Select Variables node is suitable. Thanks to this feature, SVB nodes are not limited to only one input and one output table. Output tables are displayed as separate nodes. Below we present a comparison of the implementation of a "new" and a legacy node on a simple example.
Tips and tricks
- When creating a new Workspace, a set of ready-made templates (Workspace Templates) is available that you can choose instead of an empty Workspace.
- A folder with example workspaces is available: click File/Open Examples/Workspaces.
- It is good practice to insert annotations and other information for a better understanding of the entire workflow of the analytical project. This may consist of: appropriately renaming nodes, inserting descriptions on the Home tabs, inserting annotations into the Workspace (right-click the Workspace canvas and select the Annotation option); when saving to the Enterprise meta-repository there is a section for entering a Workspace description; when creating a new version of the Workspace (with document versioning enabled): write a description of the changes from the previous version.
- As part of the workflow, you can run another Workspace using the Execute External Workspace node (reuse of already created work, simplification and division of complex workflows into partial parts).
- You can use the Workspace as a data function in TIBCO Spotfire.
- You can control the parameters available to the Citizen Data Scientist, who does not need to see the Workspace but must choose parameters for their analysis. The functions that control this are User View and Designer View.
- You can create your own tab menu with any arrangement of functional nodes: go to the Node Browser, click Create a New Node Browser configuration (Create a New Node Browser configuration), create folders with the desired functions (when opening the Node Browser you will see these folders and functions in the Node Browser) the configuration has the same structure as the ribbon menu – highlighted in orange).
- For each node you can run an additional macro (script) – usually to change the options of the output graph or to change the format of the output tables: the Customize Output option after right-clicking the node.
- If you are not sure where to find a particular node, you can use the Feature Finder function.
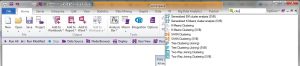
- Order of executed nodes: in some cases the order in which nodes are executed may be important; you can fully manage the execution order using the options on the Edit tab. The Root Node Order option is for setting the order of the main branches without a predecessor. Using the Child node order option you can define the order of the child nodes of the currently selected node.
- If you want a more flexible Workspace, you can use variable selection in the nodes.
- A set of nodes can be copied to another or the same Workspace by selecting them and pressing Ctrl+C and Ctrl+V. To move selected nodes within a Workspace, use the arrow keys.