Introduction
Since presenting results is an important part of our everyday work, this time we will show how to export results tables not only to MS Word. It may also be useful to know how to create your own template for results tables in Statistica.
Before we begin, let us recall that the option of creating and saving graph templates has already been covered. This article will therefore be only about tables, without graphical outputs.
Exporting a table to a Word document
There are several options for what to do next and how to export analysis results that are in table form (the following instructions show the procedure in the Ribbon view):
Exporting a table from the report
This procedure consists of two steps. First we export the resulting tables to the Statistica report, and from the report (in the second step) directly to MS Word. First, we need to set the correct size for the tables exported to the report. Via Tools – Options we increase the preset size of the tables in the report.
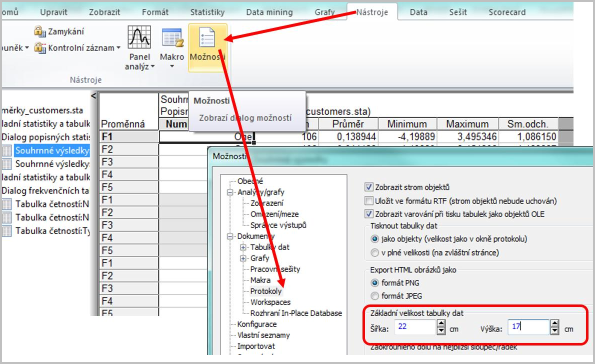
In the tree of the Options dialog, in the Reports section, we change the Default data table size from the preset 10.16 x 7.62 to a larger size and confirm with OK in the bottom right corner. Exporting a table to the report then proceeds as follows:
We select the desired table, or several resulting tables in the results workbook (holding Ctrl to select multiple outputs), and then add them to the Statistica report (using the button on the Home tab, where you will also find other export options).
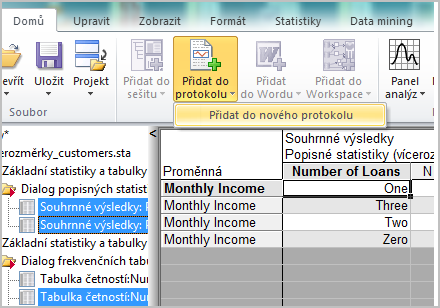
In the report, the tables should already have the correct size; if not, you will need to enlarge the size further (by stretching the table). The resulting report can then be imported into MS Word. However, this requires 100% functionality of the Windows components responsible for the interoperability of the two applications on the particular PC.
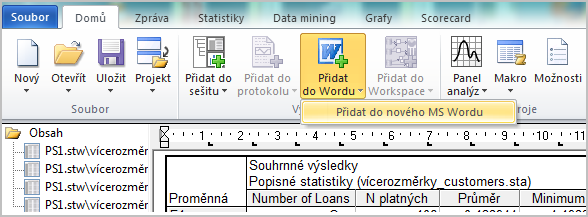
Note: The report itself can be saved in the Statistica format with the str extension, as well as rtf, html, xml, txt, and pdf files.
Note: If you have problems with this export (it does not work with the latest MS Office 2013, or if some Microsoft Windows components are not optimally available), save the outputs as an rtf document.
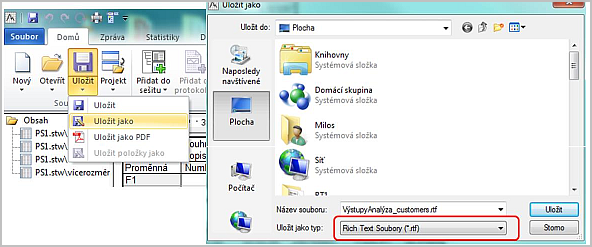
The saved ‚rtf‘ document can then be opened in MS Word and saved as a document in docx format. Alternatively, individual tables (from the rtf document) can be copied into a particular Word document between comments, etc.
Tables inserted into MS Word in this way (or imported via the report) are inserted as an object, so they have the following properties:
- their size can be easily changed (by clicking the particular object and moving the mouse) if the table is too wide for the document
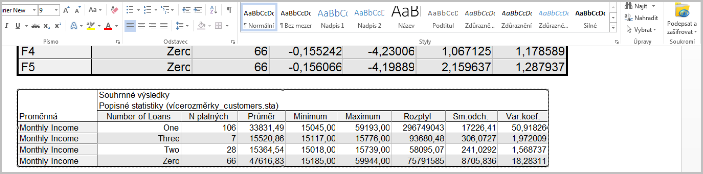
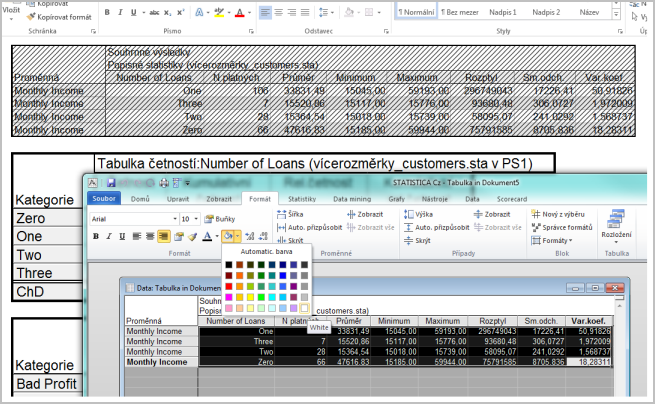
- additional changes can be made directly in Statistica: double-clicking the table in MS Word opens Statistica (if it is installed on the particular PC), and any change to this table in Statistica also triggers a change in MS Word, so you can, for example, fix the alignment, background color, font size (if you have not already done so before export), or rewrite the numeric values:
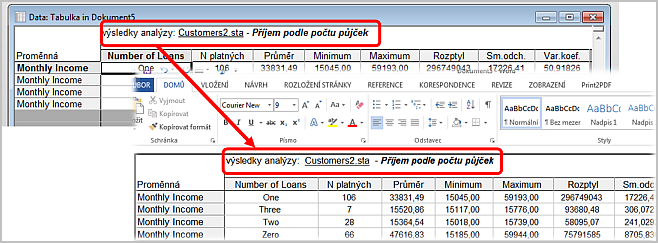
You can also, for example, edit the table header. After closing the table in Statistica, the changes are then reflected again in the resulting table in Word:
Exporting a table directly to MS Word
You simply export the resulting table to MS Word using the Add to Word button on the Home tab (similarly to what we did with the report). The output in the Word document is either in the form of an object (just like the output from the report) or in the form of an MS Word table (in this case the table is saved as a Word table, so the table and its numbers can be edited directly and only in Word). You can set how the table is saved by ticking Tools – Options – Analyses/graphs – Output manager – Insert data table into Word as an object. The functionality of exporting directly to Word is available if the table is a standalone window. If it is not and is, for example, in a Statistica workbook, then the table first needs to be made standalone: right-click the workbook item and select Extract as standalone window – Copy
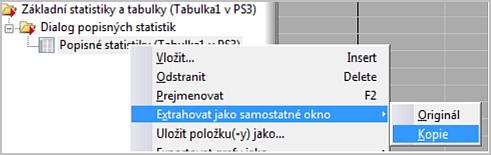
The Add to Word button will then be active on the Home tab.
Copying a table and pasting it directly into MS Word
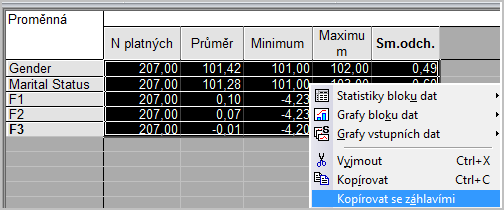
We copy the resulting table using the right mouse button and paste it into a particular part of the Word document, where it is inserted as an MS Word table:
Such a table (if it is not too large and fits into the document) can then be easily edited in MS Word using MS Word tools:
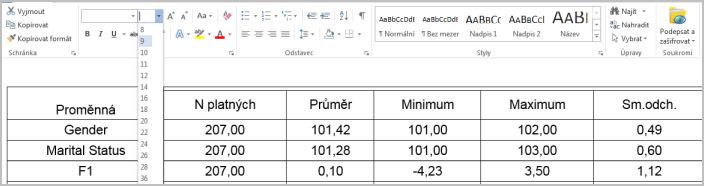
Large tables, however, cannot be easily shrunk to the page size.
Saving the result as an MS Excel table
Another option is to export the result in the form of an MS Excel document (xls, xlsx files), make additional edits in Excel, and optionally insert it into MS Word:
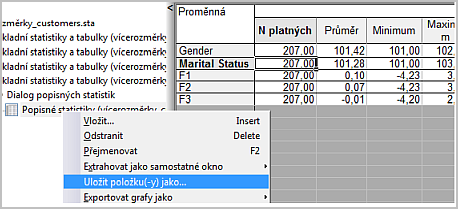
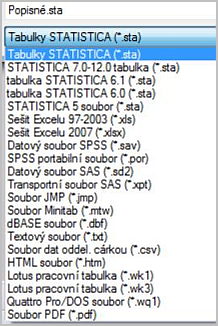
Note: The table can also be exported to other formats such as txt, csv, dbf, pdf, and other file types shown in the picture:
In Statistica you can also (in Options) set up direct automatic export of all outputs to the Statistica Report as well as to MS Word:
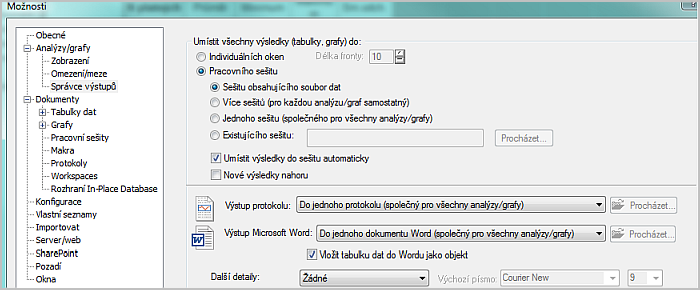
However, all the outputs you generate are inserted into the documents.
If we need only specific outputs, then we rather recommend exporting the final tables one by one (as suggested in point 1).
Template for a data table
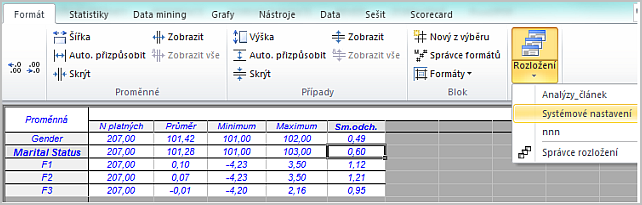
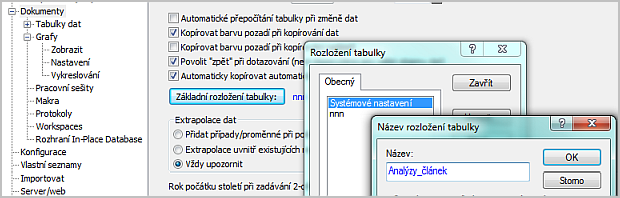
Now we will show how to save your own table format settings (a template). Via Tools – Options, in the dialog already mentioned, we select the Documents section and use the Default table layout button to open a dialog where we select New and name our own settings:
Here (in the Edit section) you can set, for example, center alignment, font size, number format, and the number of decimal places, etc.
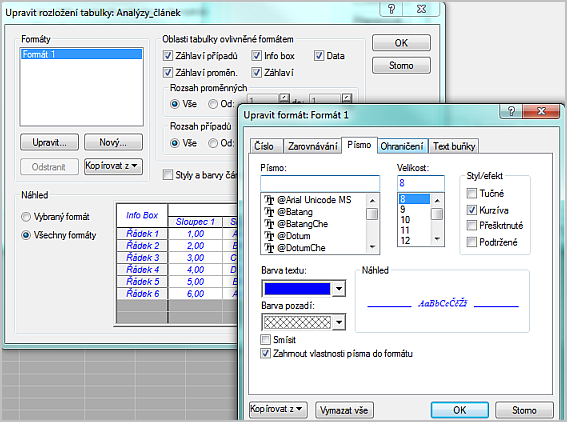
After saving (the OK button) and closing the dialog, the settings can be applied to a created table on the Format – Layout tab: