The sample data contain the results of points scored in a mathematics test. The students are divided into 4 groups, and for each student we also know their IQ value. We will be interested in whether any of the groups of students (a group can be thought of as, for example, the student's school or nationality) differs statistically in the points scored.
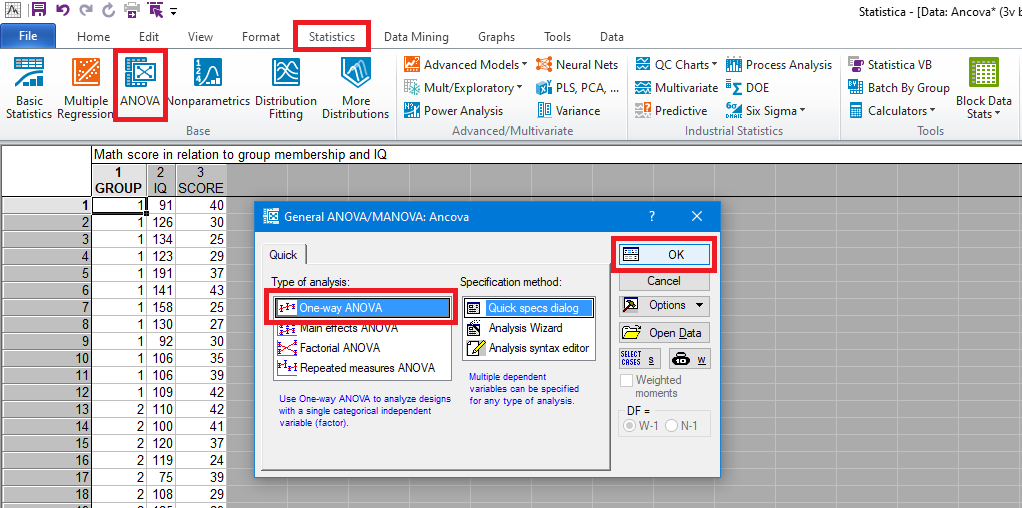
1. On the Statistics ribbon we select the ANOVA analysis. As the analysis type we choose One-way ANOVA and confirm with the OK button.
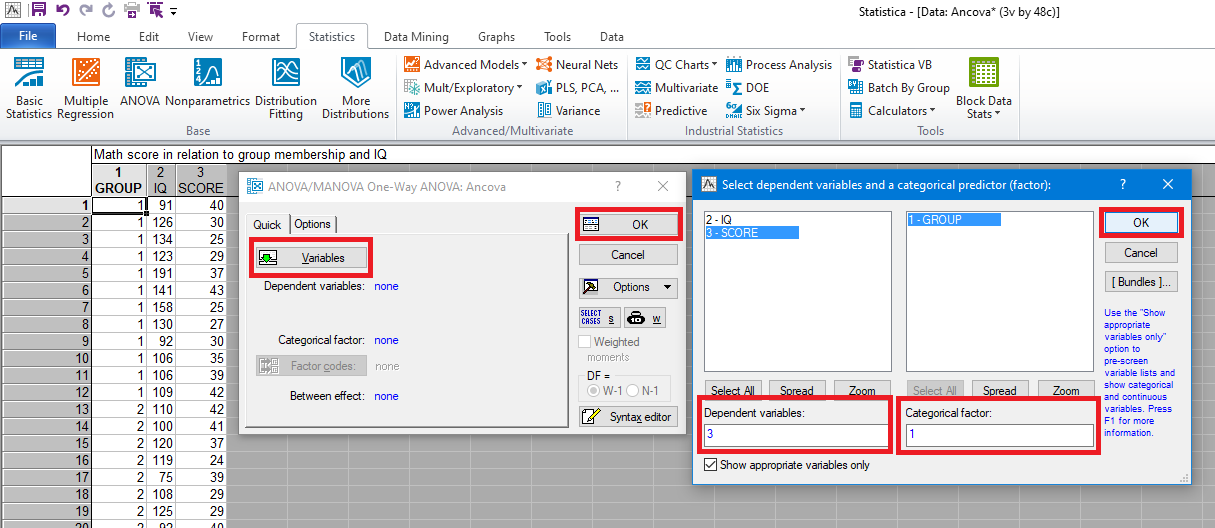
2. Next we select which variables will enter the analysis. As the grouping variable we choose the groups of students (Group) and as the dependent variable the score achieved in the test (Score). We confirm the selection with OK twice.
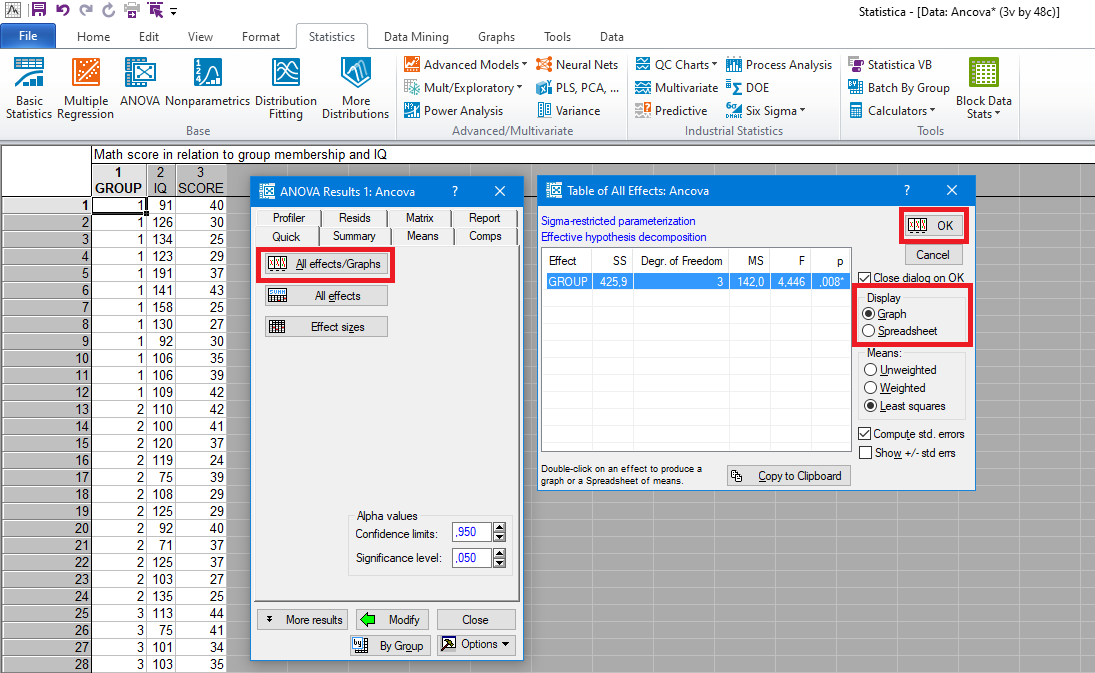
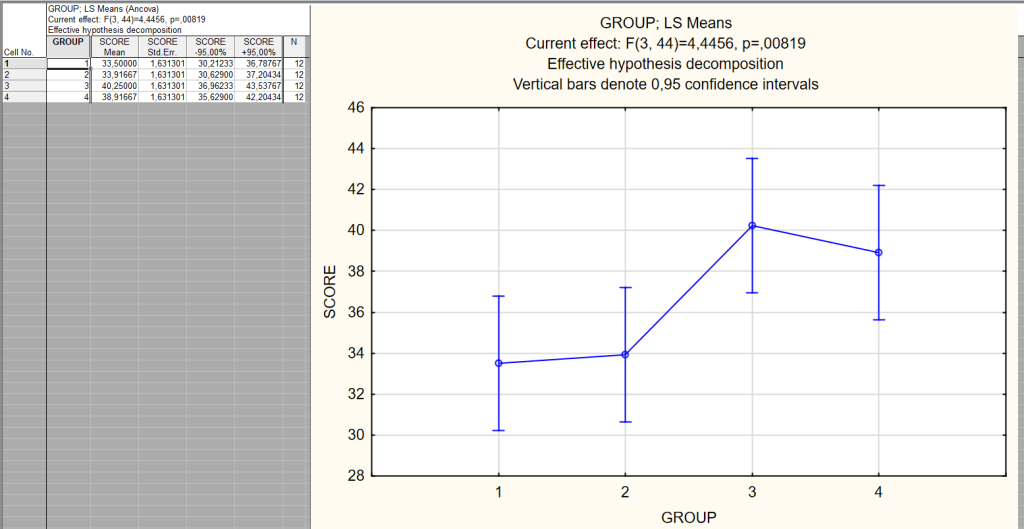
3. Next we look at the average results the students achieved in the given groups. We choose the All efects/Graphs option and in the next window select whether to display the values in a table or a graph.
Here we can see that the difference between group 1 and group 2 is not large, but between group 1 and group 3 the difference is already bigger. Now we need to verify these potential differences with a statistical calculation.
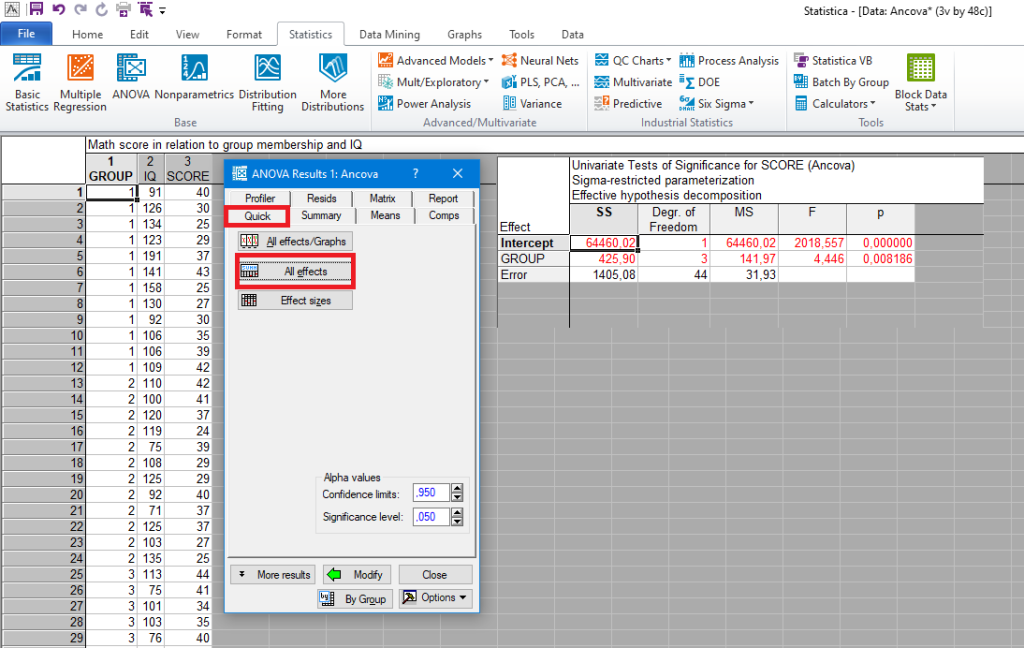
4. We return to the Quick tab and choose the All effects option. The test result pops up, where we see a very low p value. Since the value p=0.008186 is lower than the test criterion p=0.05, we reject H0 and accept H1. It therefore holds that at least one combination of groups does not have the same mean.
5. Finally, we are interested in which combinations of groups differ statistically and which do not. In the window of the running analysis we choose the More results option. In the next window we select the Post-hoc tab and choose the Scheffe test.

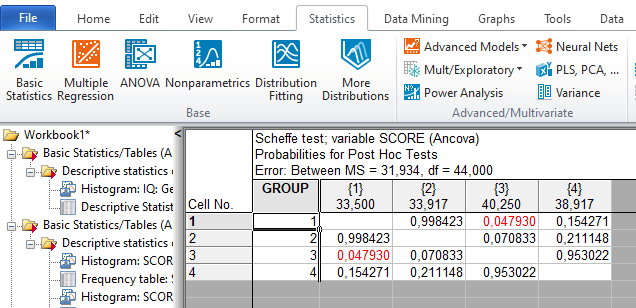
6. Here we can see the result of the Scheffe test. It is a matrix showing the test results for all combinations of groups. For the combination of group 1 and group 3, the result was p=0.047930, just below the test criterion p=0.05. We can state that there is statistical significance between group 1 and group 3, and that the number of points scored in the test differs statistically between these two groups. For the other combinations, no statistical significance was found at the alpha level of 0.05 (all other values are higher than 0.05).