The Plus Bundle was created to optimize and accelerate data processing. It includes advanced analytical modules that support the daily work of analysts, functions for summarizing survey scales and calculating indicators, and a wide selection of charts tailored to specific analytical needs. The package also includes data cleaning, preparation and formatting tools — from raw data to a comprehensive evaluation of results.
Plus Bundle is add-on to Statistica and uses Statistica as its computational environment, providing access to a comprehensive range of analytical methods.

User benefits
- Comprehensive data analysis support
- Automation and acceleration of analyses
- Reliability and precision of results
- Ease of use and flexibility
Key features
Analyses
- Linear Regression Wizard
- Logistic Regression Wizard
- Test Wizard
- ROC curves
- Meta-analysis and meta-regression
- Conjoint analysis
- Bootstrap
- Panel regression
- Inequality metrics
- Mood's median test
- Moses test for extreme reactions
- Mann–Kendall trend test
- DFBETAS measures for outliers
- DEA (Data Envelopment Analysis)
- SUR (seemingly unrelated regression models)
- Fractional regression
- Circles and cuboids for chi-square
- Arellano–Bond estimator
Nonparametric tests
- Conover's variance rank test
- Conover–Iman test
- Klotz test
- Siegel–Tukey test
- Ansari–Bradley and Lepage tests
- Fligner–Killeen test
- Brunner–Munzel test
- Skillings–Mack ANOVA
Multivariate analyses
- KMO and Bartlett's test
- Horn's test and Velicer's MAP
- Sparse PCA
- Robust PCA
- Generalized PCA
- Linear ordering
- Multivariate outliers
- Agglomeration analysis
- Determining the number of clusters
- PROFIT
- PCoA (principal coordinates analysis)
Structural equations
- Mediation
- Bifactor model
- CMV (common method variance)
Nonstandard ANOVA designs
- Factorial designs
- Simple crossover designs
- Twin crossover designs
Method evaluation and comparison
- Bland–Altman plot
- Passing–Bablok and Deming regression
- Mountain plot
- Youden plot
- Limits of detection by probit
Industry analyses (beta)
- Destructive measurements
- Process indices
Additional methods
- Measures for 2×2 tables
- Concentration analysis
- Standardized effect measures
- Post-hoc test for Friedman ANOVA
- CATANOVA
- Risk-weighted CUSUM
- Configural frequency analysis (CFA)
- Serial measurements
- Reference intervals
- Confidence intervals for ratios
- Risk profiles
- Multivariate normality tests
- Simple orthogonal regression
- Empirical distribution
- ICC (intraclass correlation)
- Harrell's C
- Odds ratio (OR) by the Gart and Fagerland–Newcombe methods
- Post-hoc tests without homogeneity of variance
- Frequency tables for multiple qualitative variables
- Chi-square test for aggregated data
- Box's test for homogeneity of covariance
- Principal response curves (PRC)
- Quadratic discriminant analysis (QDA)
- Confidence intervals for quantiles
- Jonckheere–Terpstra test for trend
- Chi-square test for variance
- Multivariate chi-square test
- Equivalence tests
- Proportionality test
- Confidence ellipses
- Frequencies for logistic regression
- Analysis of continuous variables with an atom
- Z-test for correlation
Graphs
- Bar chart
- Sequential chart
- Radar chart
- Mosaic chart
- Pie chart
- Population pyramid
- Neural network diagram
- Kohonen network diagram
- Diamond chart
- Time series baseline plot
- Wind rose diagram
- Likert chart
- Sensitivity plot
- Sunflower plot
- Violin plot
- Pyramid chart
- Butterfly chart
- Nomogram
- Four-quadrant mosaic plot
- Raw data plot
- Biplot
- Plot rotation
Data cleansing
- Data verification
- Missing data
- Dummy variables
- Fast recoding
- Variable transformations
- Value counts
- Multiple responses
Data preparation
- Sample size
- RIM weighting
- Propensity score matching
- Subsampling
- SMOTE
- ADASYN
Scales
- Semantic differential
- Rank scale
- Positional scale
- Stapel scale
- Thurstone model
- Scale reliability
- Inter-rater agreement
Tools
- Saving to an Office file
- Saving graphic files
- Formatting a spreadsheet
All modules run on top of Statistica as their computational environment.
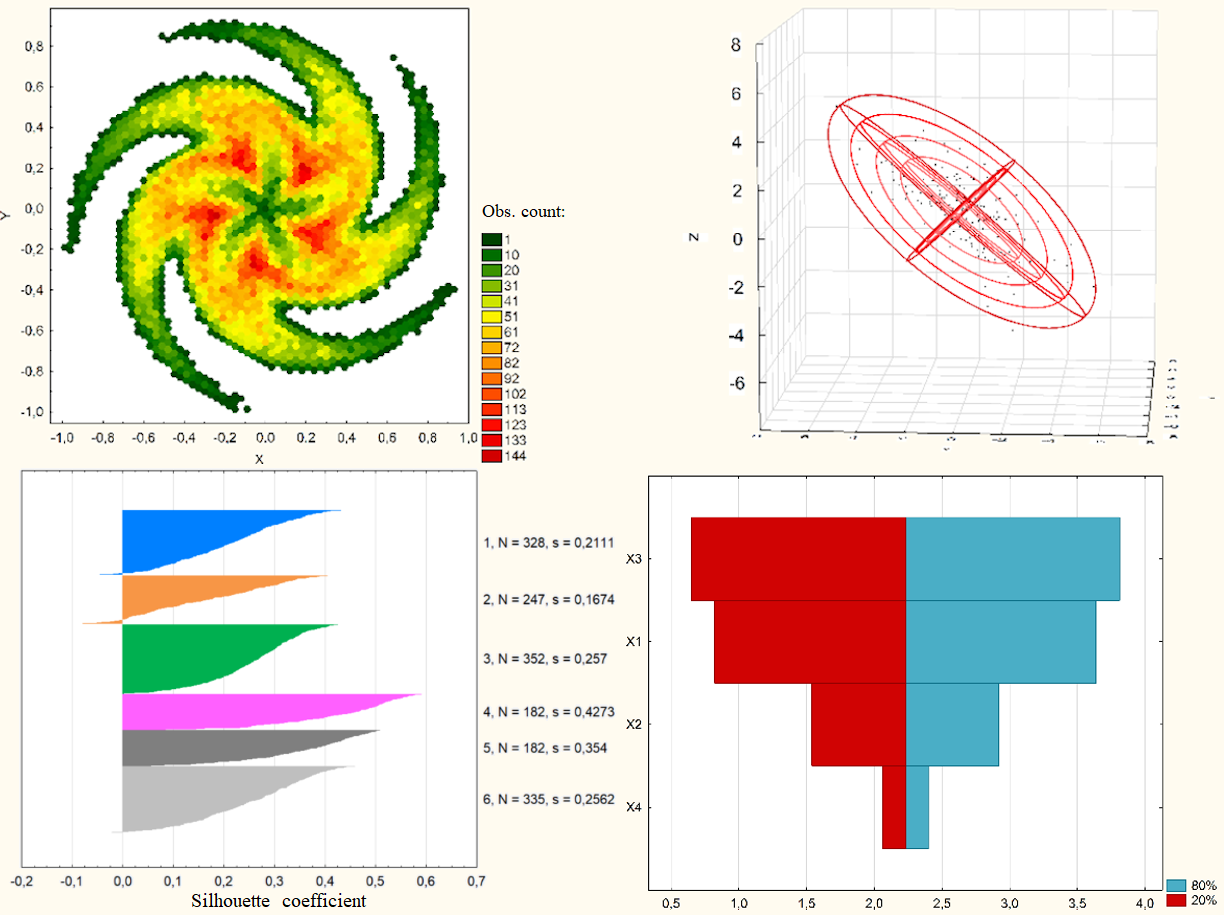
How the module works
Interested?
Plus Bundle: We will prepare a quote for the module
The module runs on top of Statistica as its computational environment. Tell us which licence you have — we send the quote within 3 business days.