The package of Maps provides graphical presentation of data related to administrative units. The program offers built-in map templates and supports *.shp files, allowing you to use your own templates. Thanks to its interactive environment, creating and editing maps is quick and intuitive, and visualization of even large datasets is clear due to extensive customization options. The ability to save style templates allows you to generate maps without reconfiguration, and additionally, ready-made maps can be saved as SVB macros.
Maps is add-on to Statistica and uses Statistica as its computational environment, providing access to a comprehensive range of analytical methods.

User benefits
- Easy and fast presentation of data on maps
- Function of using available map templates
- Function of loading your own map templates
- Workflow automation
- Easy use and flexibility
Key features
Map templates
- Poland by voivodeships
- Poland by powiat
- Poland by gmina
- Poland by electoral districts
- Poland by NUTS2 areas (regions)
- Voivodeship maps with powiat division
- Europe
Available options
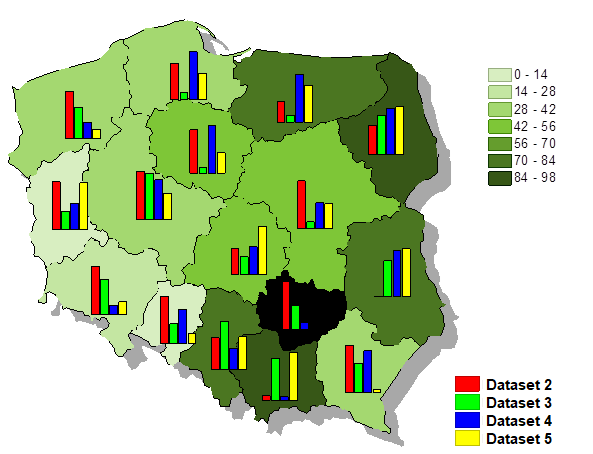
- Generating pie and bar charts
- Coloring background areas by the values of a specified variable
- Various display levels for area elements: active, inactive, hidden
- Text labels from the selected variable with the option of formatting and manual position correction
- Saving/loading all map appearance options to/from a file
- Automation of workflows with macros
- Loading *.shp files containing, for example, other administrative divisions or additional objects (rivers, roads, etc.), or previously unavailable countries
All modules run on top of Statistica as their computational environment.
How the module works
Interested?
Maps: We will prepare a quote for the module
The module runs on top of Statistica as its computational environment. Tell us which licence you have — we send the quote within 3 business days.