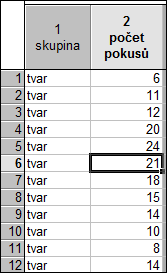
The file http://www.statsoft.cz/file1/Newsletter/kruskal.sta contains data on a group of monkeys of the same species that were randomly divided into three experimental groups. Each specimen was shown a series of objects. The task was to pick a particular object. A correct choice was rewarded. To decide correctly, it was important in the first group to identify the shape well, in the second group the color, and in the third group the size. Based on the number of attempts needed to make a successful choice, we want to decide whether tasks based on recognizing shape, color and size are equally difficult for this particular species of monkey.
Solution
A suitable method for solving this task might seem to be one-way ANOVA (analysis of simple classification). Before we start performing the analysis, however, let us check whether its assumptions are met. It would be more appropriate to test these, for example, on a pilot sample (on which we would truly only verify the assumptions). However, usually no other data are available, so we will verify the assumptions on the data we have at hand. The first assumption that needs to be verified is the normality of the dependent variable in all groups. There are several options in Statistica software; this time we will use a normal probability plot.
From the main menu we choose Graphs / 2D Graphs / Normal Probability Plots. On the Quick tab we click the Variables button and select the variable number of attempts. In the Statistics section we check the Shapiro-Wilk test for testing normality. On the Categorized tab, in the X-Categories section, we check the On option, which enables a menu where we click the Change Variable button. The Select categorization variable window opens, where we select group and confirm. We click OK once more and obtain the following normal probability plots for the individual groups.
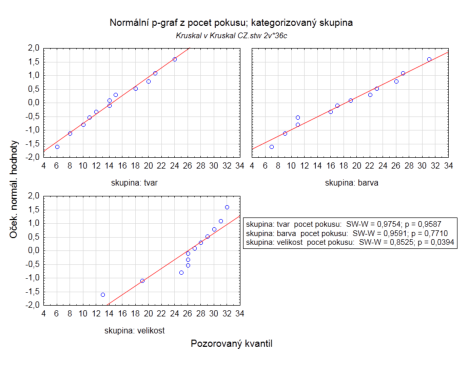
Both the plot and the values of the Shapiro-Wilk test show that in the size group the normality assumption was violated. Moreover, the number of attempts in the individual groups is very small for us to rely on the results of the central limit theorem. Instead of ANOVA, we will therefore use its nonparametric counterpart, the Kruskal-Wallis test, which is based on ranks and does not assume that the data come from a normal distribution; it does, however, assume that the observations are independent (which in our case we know from the nature of the experiment), come from a continuous distribution, and that in each group the observations come from populations with the same shape of distribution.
Besides the Kruskal-Wallis ANOVA, a median test is also available, which compares the number of observations above and below the median in the individual groups. We can therefore decide whether to use Kruskal-Wallis or the median test. It is not correct, however, to use both tests at once.
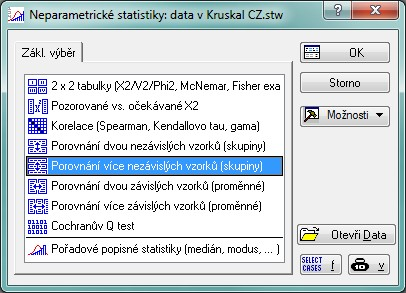
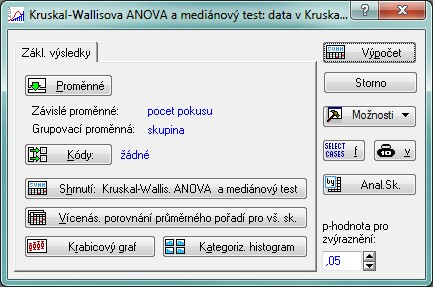
Both tests can be found in the same menu as follows: from the main menu we choose Statistics / Nonparametrics / Comparing multiple independent samples (groups). The Kruskal-Wallis ANOVA and median test dialog opens. We click the Variables button. As the dependent variable we select number of attempts. The grouping variable will be group. We click OK. The dialog should look like this:
We click the Summary button: Kruskal-Wallis ANOVA and median test. Two tables are created.
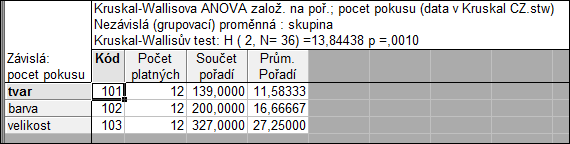
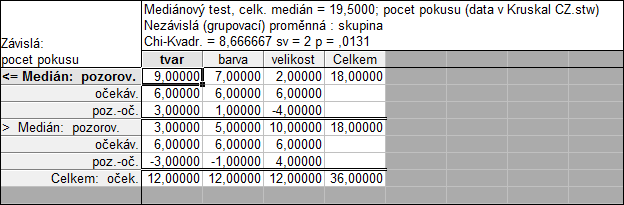
Note that the Kruskal-Wallis test does not work with the original values but with the rank numbers assigned to them. From the values of the sum of ranks for the individual groups it follows that size was the most difficult to recognize, while shape was identified most easily. We reach the same conclusions using the median test, where we examine the counts of cases above and below the common median. Again it is confirmed that objects were best recognized by shape and worst by size. If we decided in favor of the median test, its result is shown by the second table:
The results can also be displayed graphically. In the Kruskal-Wallis ANOVA and median test dialog Kruskal-Wallis ANOVA and median test we click the Box & Whisker button. We still need to select the variable we want to display in the plot, which is number of attempts, and to choose the type of box plot. We are interested in the box plot showing the median, the lower and upper quartile and the range (i.e. the first option in the Box & Whisker type dialog), because the median corresponds to the nature of the Kruskal-Wallis test.
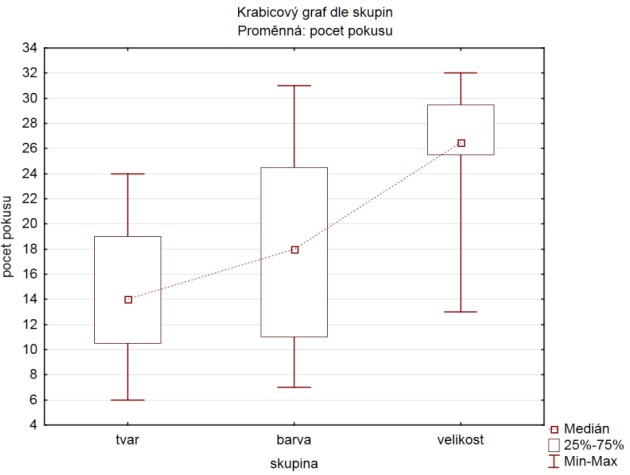
The box plot too confirms that shape was recognized most easily and that the monkeys needed the most attempts to correctly determine the size of the object.
Another way to view the distribution of the dependent variable values in the individual groups is a categorized histogram. In the Kruskal-Wallis ANOVA and median test dialog, the Categorized histogram button. A dialog opens in which we select the variable to display in the plot, i.e. number of attempts. We click OK. The result is shown in the figure.
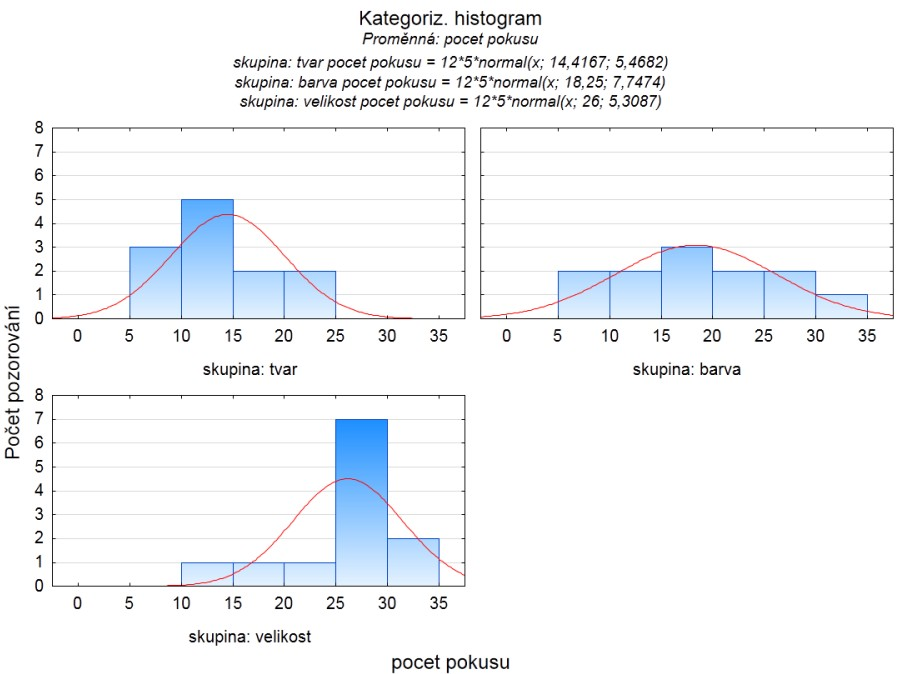
Again it is confirmed that the monkeys recognized shape better (i.e. the distribution is slightly skewed to the left) than color and size. The results appear clearly worst in the case of size.
We already know that there is a significant difference between the groups. But between which of them? We get an answer to these questions if we click the Multiple comparisons of mean ranks for all groups button in the Kruskal-Wallis ANOVA and median test dialog.
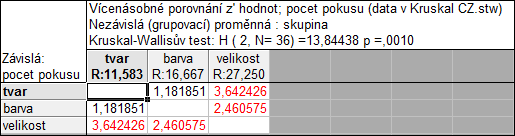
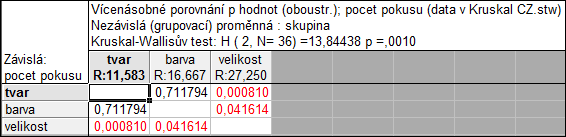
Based on the multiple comparison we can say that our specimens achieved significantly better results in determining shape and color than size. The difference in success between determining shape and color is not statistically significant. You can learn more about the background of the method in our expert course Analysis of Variance, or in the course Nonparametric Statistics.
Conclusion
As the results of the analysis suggest, we can state that there are differences among the factors and that these tasks differ in difficulty for the monkeys. Recognizing shape is the easiest, whereas size, on the contrary, causes the greatest problems. The chosen test demonstrated a significant difference between color and size, and between shape and size.